

As most of us know, Challenger is the name for one of NASA’s space shuttle orbiters that experienced a catastrophic failure on January 28, 1986 resulting in the death of all seven on board: 5 astronauts, and 2 payload specialists. It was determined that the catastrophic failure resulted after all five O-ring seals in its right solid rocket booster failed at liftoff. Apparently, the O-rings were not designed for use in cold weather as occurred the day of the tragedy when temperatures reached 36º Fahrenheit. NASA had experienced O-ring failures before, and as Figure 1 shows, there is no apparent relationship between temperature and O-ring failure.
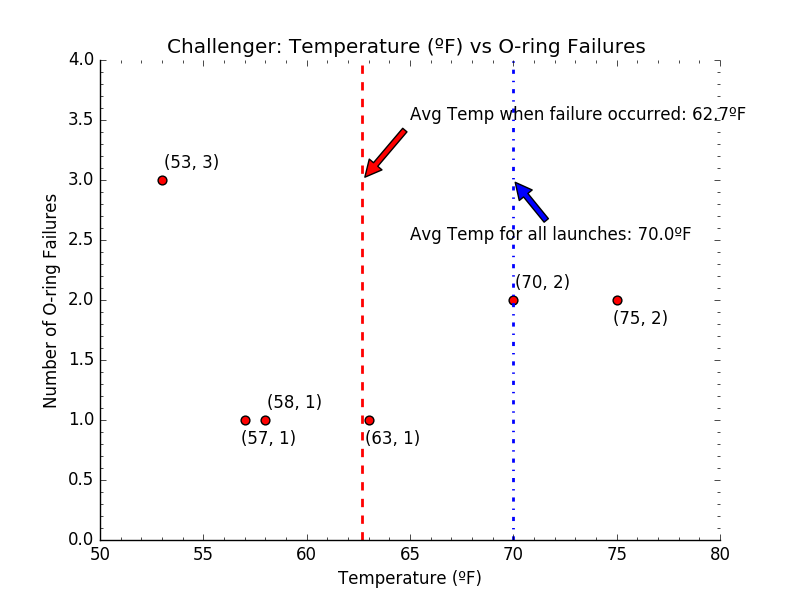
As you can see from Figure 1, the red vertical line shows the average temperature when an O-ring failure occurred, and the blue vertical line the average temperature for all launches. Furthermore, there were just as many failures above the red line as there were below it, five. This supports the idea that temperature did not play a role in the O-ring failures.
Selection of the statistical technique and proper interpretation is always a challenge, and numerous analyses have fallen short when closely scrutinized. As for the question being addressed here, it is clearly a binary classification problem. Which independent variables could answer the question: would the O-ring FAIL or NOT FAIL? This seems like a perfect application for logistic regression analysis.
The next problem is to determine which independent variables should be used? Was it the material, temperature, speed of the shuttle, fuel, vapor, or possibly atmospheric pressure? The list could be endless, and temperature, which we now know was at least a contributing cause, does not appear to be the determining factor.
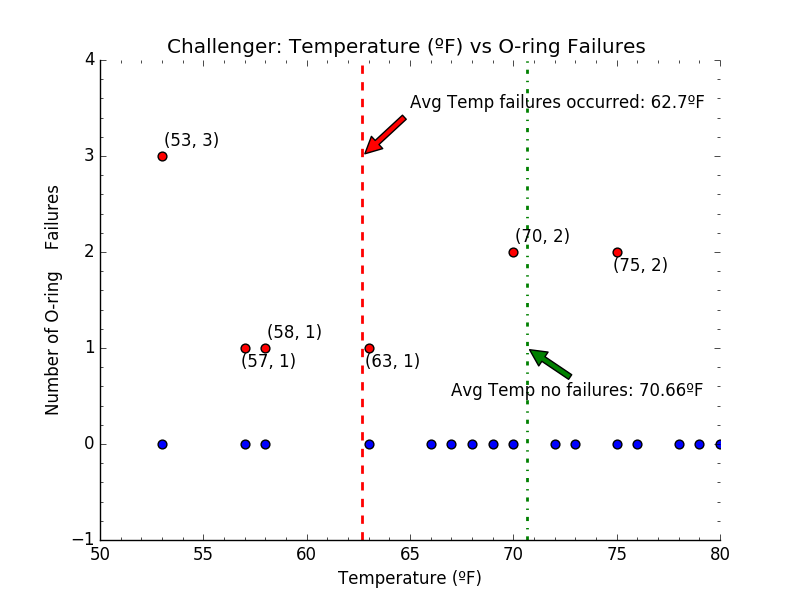
Another challenge when performing any analysis is what to do with missing data. There are methods called imputation used for replacing missing values with plausible values and sometimes this is a good solution, and other times it’s better to simply remove the observations with missing values. In this case, we have all the data we need regarding temperature and O-ring failure, and there is no missing data. However, in the exploratory data analysis if we do not consider both FAILURE and NON-FAILURE of the O-ring, then we are omitting observations from our data. In “Applied Predictive Modeling,” the authors discuss something they call “informative missingness,” and how this data provides its own patterns, and since they are missing, they are sometimes easily overlooked. There is no missing data here, but by plotting only the cases of O-ring FAILURE, the information presented by O-ring NON-FAILURE is omitted. Once the values for both cases are plotted, Figure 2 leaves a different impression than Figure 1.
As you can see from Figure 2, for launches with no O-ring failures, it appears that there is a bias for O-ring failure at lower temperatures.
The Data:
A shuttle has 5 O-rings, and there were 24 launches, which gives us a total of 120 observations. By looking at the data, one launch experienced 3 O-ring failures, one experienced 2 O-ring failures, and all the others experienced 1 O-ring failure (the launch at 70ºF is two separate launches).
The Model:
While the plots themselves do not provide enough information to establish any causal relationship between temperature and O-ring failure, they certainly provide enough visual queues to warrant more investigation. With this being a binary outcome, the appropriate algorithm appears to be logistic regression for determining whether there is a statistically significant relationship between temperature and O-ring failure.
$$H_{0}:\ Lower\ Temperature\ has\ no\ effect\ on\ O-ring\ failure$$
$$H_{A}:\ Lower\ Temperature\ does\ effect\ O-ring\ failure$$
Dependent Variable: O-ring No FAILURE/FAILURE (0/1)
Independent Variable: Temperature in Degrees Fahrenheit
The temperature on the morning of the catastrophe was 36ºF.
Prior to the incident, and as our data reflects, there had been 10 FAILURES and 110 NO FAILURES
The question addressed by the model is: What is the likelihood of an O-ring failure in relation to the temperature.
The probability that $$y\ =\ 1$$ is given by the following formula:
![]()
More specifically, we are interested in the probability that $$y\ =\ 1$$ given that X equals 36. Here is the formula:
$$P(y\ =\ 1\ |\ X\ =\ 36)\ =\ {{e^{\beta_{0}\ +\ \beta X}}\over{1\ +\ e^{\beta_{0}\ +\ \beta X}}}$$
The results from the logit.fit() command in Python 3.5.2 (complete code below):
[snippet slug=logitchallenger line_numbers=false lang=python]
The results from the regression analysis are shown above. As you can see, there are 120 observations. You see that the confidence interval for ß is between -0.239 and -0.054. Since this range does not include 0, ß is considered significant. The P-value of 0.002 is considerably less than 0.05, also implying the significance of ß. This gives us a 95% degree of confidence that temperature does have an effect on the likelihood of O-ring failure. The null hypothesis is rejected.
$$H_{0}:\ REJECTED$$
The negative sign of the coefficient for X is inversely related and tells us that the odds of O-ring failure decrease by approximately 14% for every increase in temperature of 1ºF.
The exponential of the X coefficient is called the odds ratio, and is 0.86.
As shown from the output result.predict((1, 36)) = 0.89349705 ~ 90% (Confirmed in R: 0.89349705), the probability of O-ring failure given the temperature = 36ºF is 89.35%
![]()
This is the probability of one O-ring failing. What is the probability of all 5 O-rings failing? The failure of each O-ring is an independent result, and therefore, the probability of two independent events occurring is the product of their probabilities. Like with dice, the probability of rolling a 1 on a fair die is 1/6, and the probability of rolling two 1’s is 1/36. Therefore, the probability of all five O-rings failing is $$(0.89349705)^{5}\ \ =\ \ 0.56946313520312\ \cong\ 57$$ %.
Conclusion:
There are certainly some caveats you would want to add to this analysis, but based on the limited amount of data available, I would not want to be on a rocket that has a 57% probability of catastrophic failure, and I am sure had the NASA management realized the risk, they would have aborted the mission. The important caveats are that this is a very simple logistic regression model with only one predictor. Also, in the data set, there were no observations that were close to the 36ºF that existed on the day of the failure. There are probably numerous caveats, but the fact remains that this evidence alone probably would have convinced management to abort the mission and save the seven lives that were lost that day.
NASA now has a statistician available for every launch.
Python Code:
[snippet slug=challengercode line_numbers=false lang=python]
0 responses to “Logistic Regression Case Study: The Challenger”
I wrote this at MIT XPro as well.
Thanks a lot Randall. I liked your stuff as well. I am wondering if somebody from MIT XPro can give some feedback here. The probability of a failure at 70F is about 0.054 and a failure at 75F is about 0.027. The graft of data (and data) gives a probability of 0.2 (2/10) at 75. No data below 53 F. Maybe using logistic regression is not the right method here? What model(s) did the rocket scientists (NASA) use? How did they eliminated this problem.
Kaare, my apologies for the delayed response. I haven’t reviewed this problem in some time, but as I recall, where the significance of temperature becomes obvious is when you plot the launches that occurred without a failure. It becomes visibly obvious that the failures occur predominately at the lower temperatures, it would have made sense to halt the launch since this particular launch would have been the coldest temperature ever for a launch.